
Hyper-Profitable Crops – 2025 Results

Introduction
The Hyper-Profitable Crops project provides an opportunity for cereal growers to benchmark the performance of their crop against other growers in the region. The results are kept anonymous, but the reports allow each grower to assess their performance against the other crops in the group, based on different performance measures. Growers also have the opportunity to share their learnings in discussion groups.
Method
Seven cereal growers participated in the Hyper-Profitable Crops project in 2025. The growers were formed into two discussion groups based around Temora and Harden. The paddocks monitored ranged from Coolamon in the west to Thuddungra in the east, and from Bimbi in the north to Junee in the south.
Each participant identified a cereal cropping paddock to monitor, and provided information for that paddock around crop variety, sowing date, harvest date, and details of all inputs and operations in that paddock.
This information was used to generate performance indicators based on potential yield for that location in that season, cost of inputs, crop yield and value of the grain produced.
Each grower received a report showing how their own paddock performed relative to the other six paddocks in the FarmLink region. The results displayed below are taken from a deidentified version of this report.
Results
In the results displayed below, each paddock appears in the same position in all graphs. Light blue bars are for growers who participated in the Harden discussion group, while dark blue bars indicate the Temora discussion group.
Potential yield can be estimated from climatic data at a location, by two different calculations. Photothermal quotient (PTQ) limited yield captures the impact of radiation (day length and clear sunny skies) as the driver of photosynthesis, and temperature as the driver of crop development, so that long, bright days and cool temperatures lengthen the duration of the phase when grain number is set while maximising the photosynthate available. Water limited yield estimates the potential yield possible given the soil moisture available at the beginning of the season and the rainfall received during the growing season.
Figure 1 displays PTQ limited potential yield (green arrows) and water limited potential yield (blue arrows) for 2025 growing season and establishes the actual potential yield in 2025 for each site (blue bars). In all cases potential yield in 2025 was limited by water availability, at around 50% of PTQ limited potential yield. In other words, water availability restricted the potential yield of these crops to around half of what might otherwise have been achieved based on sunshine and temperature conditions.
This calculation of potential yield sets the bar for comparisons between the paddocks. This levels the playing field for comparisons, as each paddock is compared on the basis of how well it performed relative to the potential yield at its location. Note that potential yield at the seven sites ranges from under 5 to around 8 t/ha, depending on the location of the paddocks and weather conditions during 2025.
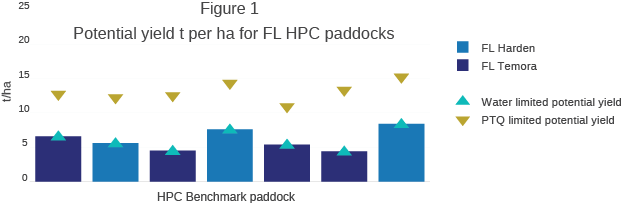
Figure 1 Calculated potential yield for 2025 for each paddock (blue bars), relative to water limited potential yield (blue arrows) and photothermal quotient (PTQ) potential yield (green arrows)
Actual yield achieved compared to potential yield is displayed in Figure 2. A dotted line indicating 80% of potential yield is included for comparison. Two of the sites achieved close to 100% of potential yield in 2025, with other sites achieving between 60 & 80% of potential yield.
However, achieving a high percentage of potential yield does not necessarily indicate a successful crop. If that high yield comes at a high cost, the gross margin for a high yielding crop may be lower than for a more moderate yielding crop with lower input costs.
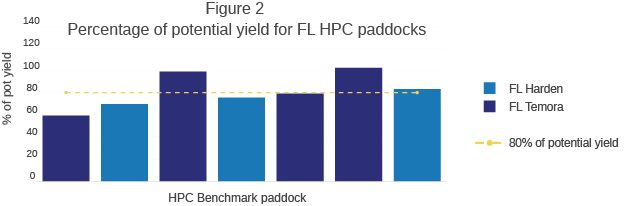
Figure 2 Actual yield expressed as a percentage of potential yield calculated for each paddock, 80% of potential yield indicated by dotted line
Figure 3 displays gross margin per tonne of potential yield at each site. This indicates which sites achieved the best possible gross margin given the limitations of weather at the site in 2025.
The two sites to the far right of the graph achieved the highest gross margin per tonne of potential yield, over $140. Reference to Figure 1 indicates that these sites had widely different potential yield (around 4.5 vs 8t/ha). Further, Figure 2 indicates that only the second site from the right achieved 100% of potential yield for the site, while the furthest right site achieved just over 80% of potential yield. However, the cost of inputs and the value of grain produced saw them achieve very similar gross return per tonne of potential yield.
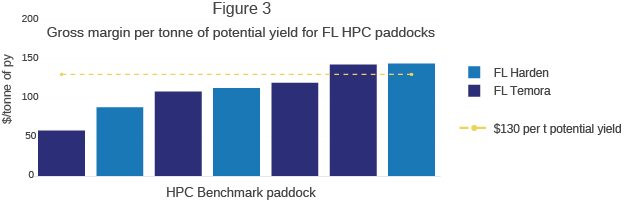
Figure 3 Gross margin per tonne of potential yield, $130/t potential yield indicated by dotted line
By comparison, the site third from the left achieved around 100% of potential yield (Figure 2), but a gross return of only approximately $110/t potential yield. This reflects higher input costs per tonne of potential yield at this site (data not shown here).
It should be noted that there are no winners or losers in this comparison, the exercise gives the participants an opportunity to consider their performance relative to other growers in the region.
Added value is gained by the participants in the discussion groups, where they can share their learnings from the comparisons, and query each other about their approach to cropping.
A deidentified full report of the 2025 season benchmarking is available here.
It is not too late to join this program if you are interested. Please contact Mark Skewes.