

When More Nitrogen Doesn’t Mean More Grain


Introduction
Getting nitrogen fertiliser rates right is one of the trickiest calls a dryland grain grower has to make. Too little, and crops don’t reach their potential if the season is wet; too much, and you waste money if it stays dry. Since 2022, FarmLink Research has been testing different nitrogen strategies at Temora as part of the national RiskWi$e project. Because a strategy that works well in one season can fall short in another, the trial has run the same approaches side by side for several years, building a more reliable picture of their performance over time. This article looks at how different strategies performed in the 2025 season.
Methodology
The trial site consisted of a small plot-level trial (Randomised Complete Block Design) with 4 replicates and 12 treatments. Table 1 shows the treatments included in the trial, along with descriptions, representing a range of nitrogen decision strategies that reflect growers’ approaches to fertiliser application rates.
Treatments 4 to 7 (YP) used the decision-support tool Yield Prophet Lite to calculate the required nitrogen, using pre-sowing soil nitrogen levels, plant-available water, and assumptions about growing-season rainfall.
Nitrogen application for Treatments 8 to 10 (N-Bank) was based on providing a preset level of N in the soil. Pre-sowing soil tests determined the residual N available, and applications were calculated to refill soil N to the targets noted in Table 1.
Standard crop management practices were implemented to avoid yield-limiting complications, and a standard rate of 80 kg/ha MAP was applied at sowing throughout. Barley was the crop in most treatments in 2025, with Treatment 12 being sown to Vetch.
| No | Name | Notes | Code |
|---|---|---|---|
| 1 | Nil N Control | 8 kg N/ha MAP at sowing | NIL |
| 2 | District Practice | 45 kg N/ha | DIS |
| 3 | Replacement Rate | Replace N removed in previous harvest | REP |
| 4 | YP Lite - Decile 2-3 | Yield Prophet Lite 75th percentile | YP_D3 |
| 5 | YP Lite - Decile 5 | Yield Prophet Lite 50th percentile | YP_D5 |
| 6 | YP Lite - Decile 7-8 | Yield Prophet Lite 25th percentile | YP_D7 |
| 7 | YP Lite - BoM | Yield Prophet Lite BoM Forecast | YP_BOM |
| 8 | N-Bank - Conservative | Soil N: 175 kg/ha Temora | NB_CON |
| 9 | N-Bank - Profit Optimal | Soil N: 200 kg/ha Temora | NB_PRF |
| 10 | N-Bank - Yield Optimal | Soil N: 225 kg/ha Temora | NB_YLD |
| 11 | Rotation – Vetch/Canola | 8 kg N/ha MAP at sowing | ROT_L |
| 12 | Rotation – Wheat/Vetch | 8 kg N/ha MAP at sowing | ROT_N |
Results & Discussion
Grain yield showed almost no relationship with the rate of nitrogen fertiliser applied in 2025. Treatments receiving very different fertiliser rates produced similar yields, indicating that additional fertiliser nitrogen provided no meaningful yield benefit under the season’s conditions.
Partial N supply combines both applied fertiliser and starting soil mineral nitrogen, representing the total nitrogen available to the crop from these sources. It doesn’t take account of potential mineralisation during the season.
Plotting partial nitrogen supply against yield produced a similarly flat relationship (Figure 1). Whether a treatment had very little nitrogen available or several times that amount, yield stayed in much the same range, with no clear upward trend as N supply increased. This flat response reflects the dry, decile 3 growing season in 2025, where limited and poorly timed rainfall capped yield potential well before nitrogen availability became a constraint, leaving the crop unable to use the extra nitrogen on offer regardless of where it came from.
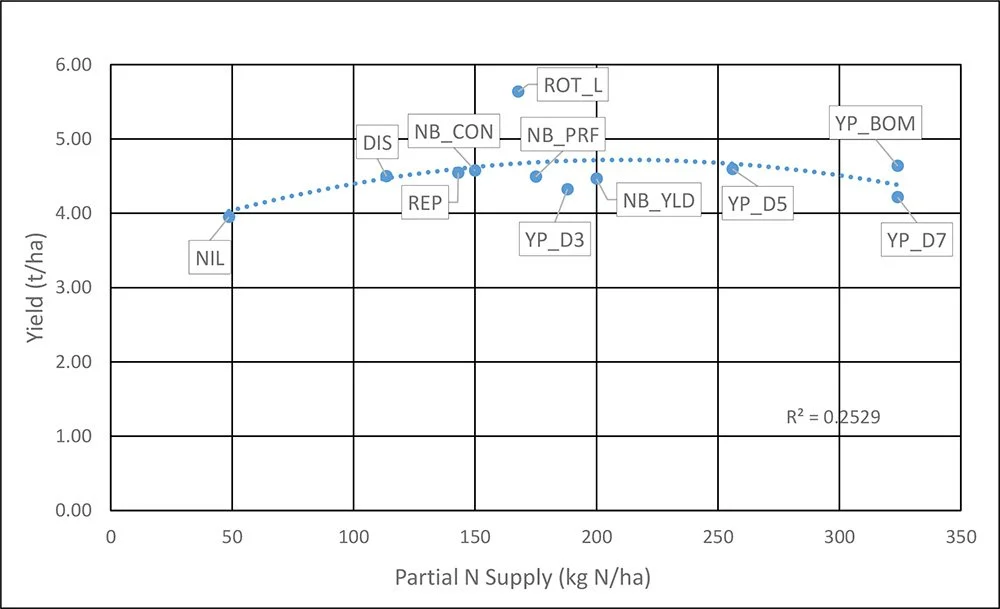
Figure 1 Grain yield response to partial nitrogen supply across the treatments in 2025
In contrast to yield, grain protein showed a strong positive relationship with partial N supply (Figure 2). This pattern is consistent with a season where yield was capped by moisture rather than nitrogen — with less nitrogen being converted into grain bulk, more of what was taken up was instead reflected in higher grain protein, particularly in treatments with greater nitrogen supply.
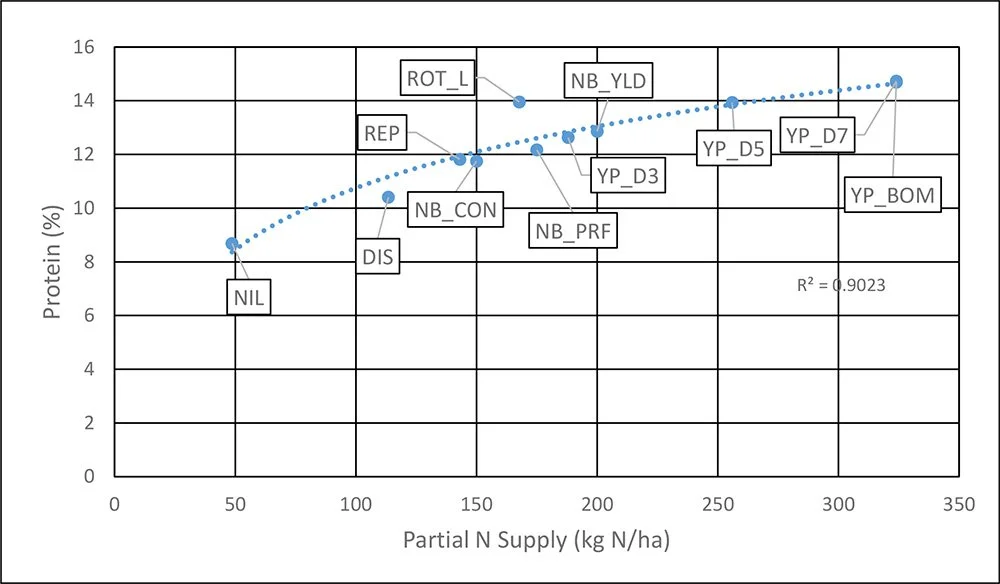
Figure 2 Grain protein response to partial nitrogen supply across the treatments in 2025
Gross margin peaked at moderate partial N supply and declined at the highest rates (Figure 3), as fertiliser costs outweighed any yield or protein benefit in this dry season. Treatments like YP_D7 and YP_BOM, which committed to high nitrogen ahead of an uncertain finish, returned the weakest margins.
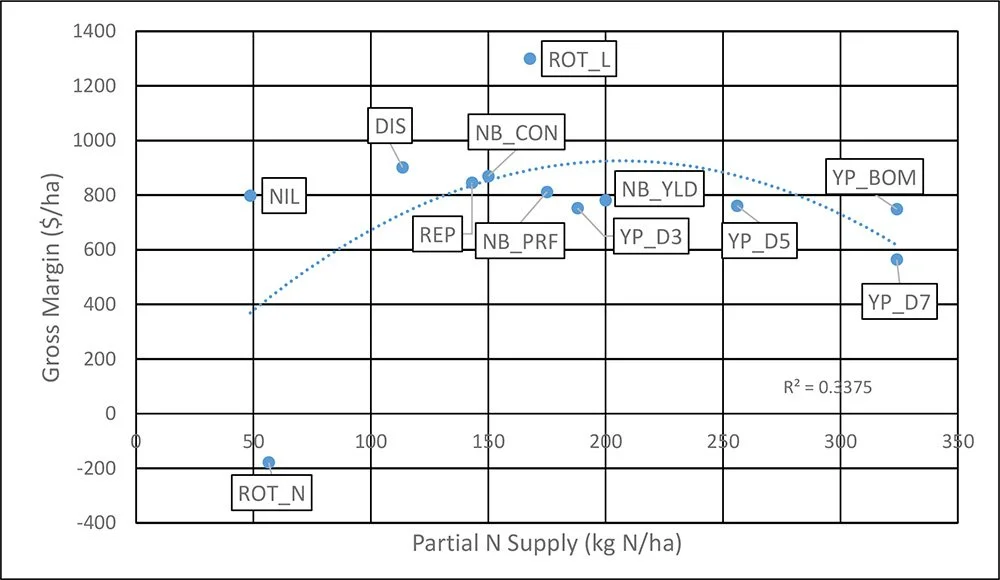
Figure 3 Gross margin response to partial nitrogen supply across treatments in 2025
Moderate-N treatments, aided by banked or replacement soil nitrogen, matched the season’s realised yield potential without extra fertiliser cost, reinforcing the value of nitrogen decisions that stay responsive to seasonal conditions and existing soil reserves, rather than committing early to high-input strategies.
Conclusion
The 2025 season showed that no single nitrogen decision is always right; different strategies suit conditions that cannot be known in advance. A strategy that performs well in one season may underperform in the next. In 2025, moisture rather than nitrogen limited yield, so higher-input strategies increased costs without delivering comparable returns. More conservative approaches, supported by residual soil nitrogen, better matched the season’s realised potential and produced stronger margins.